
This week we continue with the analysis of some of the most popular instruments with the currency pair GBP/USD, which was one of the best performing forex pairs last week. To a large extent, the arguments in the analysis remain valid when trading other crosses, due to the interdependence of the markets.
The below chart shows GBP/USD on a 4-hour (left panel) and daily (right panel) time frame. Below the price charts are Stochastic indicators (30, 10, 10). In terms of the so-called momentum trend, there is no confirmation between Stochastics in two time frames, which means probable consolidation in the week ahead.
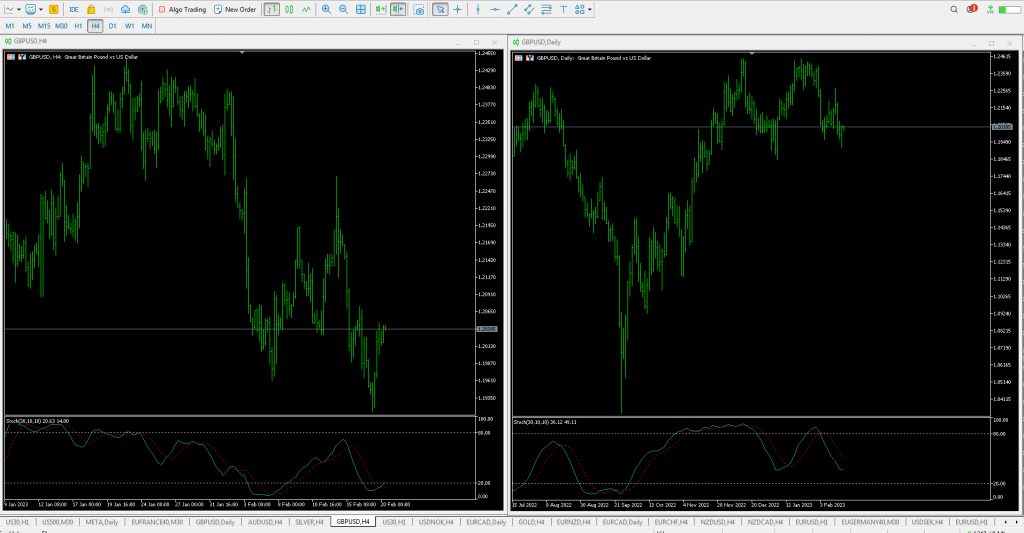
Source: Deltastock MT5
Strengths
- Last week, the UK released retail sales data (+0.5%, vs. – 0.3% exp. MoM) with the reading being better than the US retails sales.
- The data also shows that theUK regular wages grew at their fastest pace outside of the Covid pandemic period at 6.7% in the year to December, said the British Office of National Statistics, outstripping growth of 6.5% seen the year before and economist expectations for 6.5% growth.
Weaknesses
- Last week, the release of the data on soft UK CPI more than erased the impact of firm labour market data, as the negative 0.4% miss on core CPI YoY at 5.8% YoY (vs. 6.2% expected and 6.3% in December) will more likely keep the Bank of England happy with its complacent inflation forecast and rate guidance.
- UK 2-year yields are coming lower after this UK CPI release, while the U.S. 2-year yield closed at a local high on the U.S. own CPI data yesterday. This has engineered a steep sell-off after the zany pump in GBP/USD.
- The US 2-year benchmark has now pushed up close to the multi-year highs near 4.80%, highest daily close last November was 4.72%), while the 10-year benchmark yield nudged above the late December peak of 3.90%, leaving only the highs above 4.25% from last October/November.
Opportunities
- The narrative of recent months is that the U.S. economy was sliding into recession and this would bring down inflation and allow the Federal Reserve to end its interest rate hiking cycle.
- The medium-term outlook for the UK economy and assets is, however, greatly improved by the prospect of lower inflation, which the Bank of England believes will fall back to the 2.0% target by 2024.
- Lower inflation in the UK next year should support a rebound in real income and consumer spending in H1 2024, as shown in last week’s retail sales data.
Threats
- Further signs of reaccelerating inflation pressure could continue to drive U.S. yields higher, but the critical U.S. data, this Friday’s January PCE inflation data, is not up until the week after next.
- This week features few key event risks on the U.S. calendar, the chief two being the FOMC minutes on Wednesday and the PCE Inflation data on Friday as noted above.
- U.S. yields grinding higher still, the dollar was firmer again and hit fresh highs since 6 of January. A hot PPI, still low jobless claims and Fed speakers, together with the weakening risk sentiment are all supportive for the greenback.
In conclusion, there is some interesting metric for market risk valuation.
UK 5 – Year CDS (Credit Default Swaps) value changed +0% during last week, +0% during last month, -34.03% during last year.
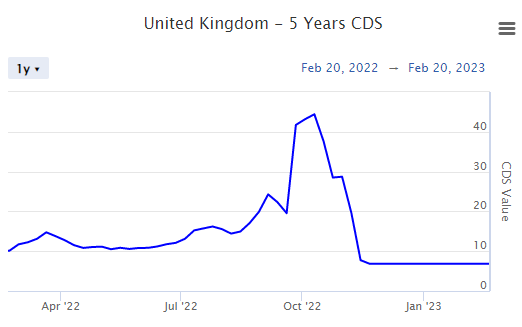
Source: https://www.worldgovernmentbonds.com/
USA 5 – Year CDS value changed -0.03% during last week, +0% during last month, +177.95% during last year.
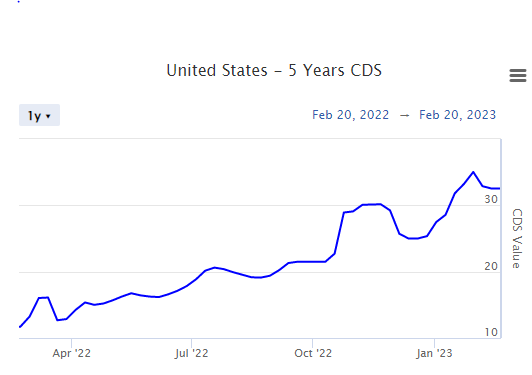
Source: https://www.worldgovernmentbonds.com/
In this respect, the USA state debt is relatively more risky than the UK, according to the data shown above.
Deltastock Capital Markets department
Risk warning:
This article is for information purposes only. It does not post a buy or sell recommendation for any of the financial instruments herein analysed.
Deltastock AD assumes no responsibility for errors, inaccuracies or omissions in these materials, nor shall it be liable for damages arising out of any person’s reliance upon the information on this page.
76% of retail investor accounts lose money when trading CFDs with this provider.