Author: DeltaStock
Reading time: 8 minutes
As you probably know, online trading is generally split into two camps: those who enjoy entering and exiting markets at breakneck speeds and those who are in it for the long run and prefer the more laid-back approach of holding positions for weeks, months, and even years on end.
Swing trading, however, lies somewhere in the middle. Not as fast-paced as your typical day trading or scalping session, it’s still dynamic enough to get your adrenaline pumping, while also giving you the flexibility to step away from the screen every now and then when needed.
So, what is swing trading and should you incorporate it into your daily routine?
The basics of swing trading explained
At its core, this trading style is all about taking advantage of small slices of larger moves in order to make smaller, but more consistent profits. This, however, doesn’t mean that trades can’t last more than a day as it all depends on the type of market you’re trading. As a rule of thumb, however, this style focuses on quick trades as opposed to holding long positions.
Why is it called swing trading? As we know, any sudden price changes that go against the established market trend are called “swings”. Here, we distinguish “swing highs”, or when a major high is reached, and “swing lows”, or when a major low is reached. Since practitioners of this style will regard these turning points as opportunities to either enter or exit the market, they are essentially trading these price swings. Because of this, swing traders would often buy during an upswing (go long) and sell during a downswing (go short).
So, how do you predict precisely when the market will arrive at its highest or lowest point? You don’t, but that’s really besides the point. What swing traders do instead is ride as much of the price movement as possible before the market starts to go in reverse.
Are swing trading and day trading the same thing?
On the surface, both trading styles can appear nearly identical, however, there are some important differences that we will now discuss. The main one is that day traders focus on closing all of their positions before the day is over – it’s in the name, after all. Swing traders are not limited to this requirement, and so trades can last anywhere between 30 minutes and up to several days, depending on the market conditions and the trader’s risk appetite.
Popular swing trading strategies
Two of the most popular strategies are called trend trading and breakout trading. Let’s take a closer look at what sets both apart.
Trend trading – a closer look
To employ this strategy, you need to learn how to read technical indicators as they will help you define where the market is headed next. This will allow you to hop into the market as soon as you spot any upcoming swing highs or lows. The reasoning behind this strategy is simple.
If a swing trader believes that the market has the potential to stretch higher, then they will take up a long position. If they instead expect the price to stretch lower, the trader opens a short position. The position is then held until further analysis indicates that a trend reversal is just ahead, at which point they close the position and pocket the price difference.
The breakout trading approach
In breakout trading, the trader’s main goal is to take a position in the direction of the market trend as soon as possible in order to ride the movement for as long as possible. To do so, they will often search for levels that signal that the market is just about to “break out” from its range-locked trading session. This usually happens right after a support or resistance is breached. A crucial part of breakout trading is figuring out how strong or weak is the current market momentum, which is typically measured by looking up the volume of placed trades.
The top 3 most used indicators in swing trading
More often than not, swing trading is all about choosing the right market indicators in order to outline potential market swings and identify good market entry and exit points. Here are some of the most popular technical indicators that are used daily by professional swing traders.
Moving Averages
First things first – when using moving averages (MAs), our main goal is to confirm a trend, rather than make a detailed forecast. The main reasoning for this is that MAs fall under the so-called lagging indicators category, which simply means that these tools stay slightly behind the market price and don’t offer information in real time. Essentially, when the asset’s price is above the MA, we observe an uptrend, while slumps below the MA count as a downtrend.
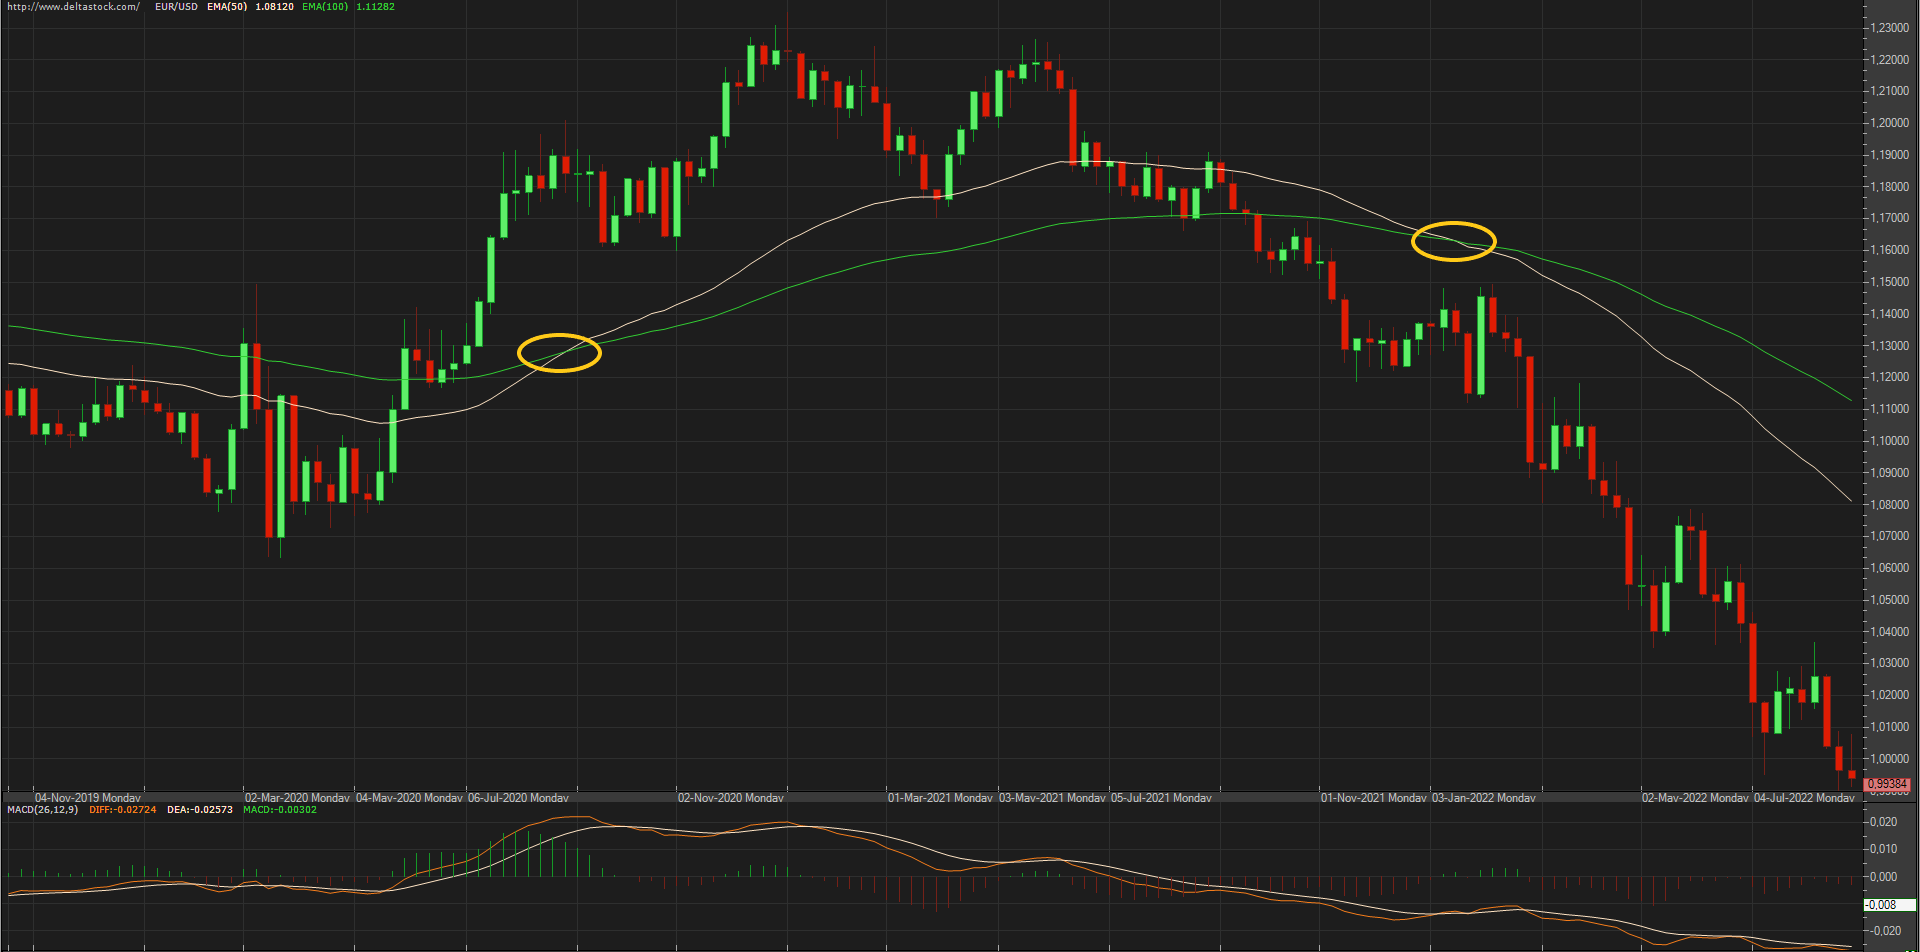
Source: Delta Trading
On the price chart above we see one of the most common MA strategies used by swing traders – tracking the market using a combination of two types of exponential moving averages (EMAs). The yellow line represents the 50-day EMA, while the green line shows the 100-day EMA. When both averages cross paths (indicated by the yellow circles), this can hint at an upcoming price swing. For example, if the fast (50-day) EMA goes above the slower EMA, the swing trader could place a long position, while the opposite scenario would require them to place a short position.
The RSI index
The Relative Strength Index is a type of oscillator that goes from 0 to 100. Values above 70 indicate an overbought market, while prices under 30 indicate an oversold market. The main idea here is to use this momentum indicator in order to figure out when a market trend could be about to swing and to then swiftly enter and capitalise on the price movements.
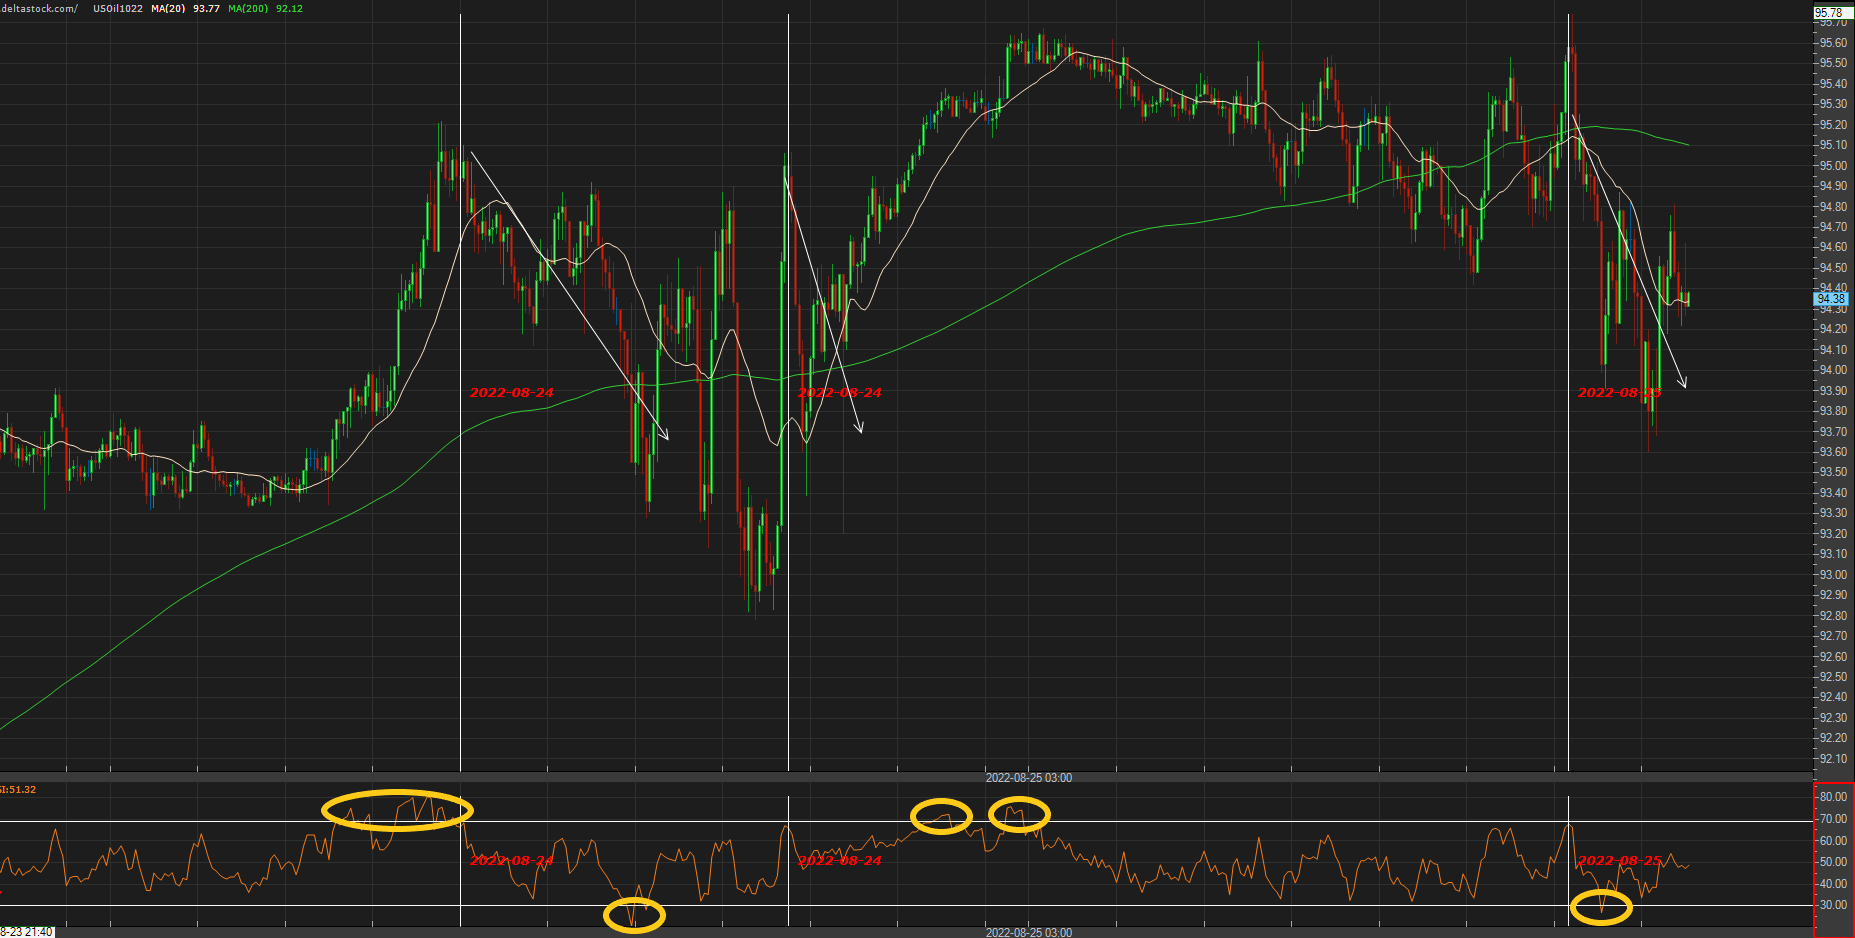
Source: Delta Trading
On the chart above, the areas at which the market has either crossed the upper (70) or lower (30) boundary of the RSI range are indicated by the yellow circles. During an uptrend, RSI values that show an oversold market could be a signal to enter a trade, while a market edging into overbought territory could hint that now would be a good time to exit the trade. In a downtrend, the reverse is in effect – an overbought market makes for a good entry point, while an oversold one constitutes a good exit point.
The stochastic oscillator
Just like the RSI above, this tool is also a type of momentum indicator, but it is instead used to predict when a price trend is about to end and ranges from 0 to 100. Since stochastic is a leading indicator, meaning that it precedes the actual price changes, swing traders can use it to forecast future market swings. It works by comparing a market’s most recent closing price to a trading range within a certain period (typically 14 days). Values under 20 suggest an overbought market, while values over 80 indicate an oversold market.
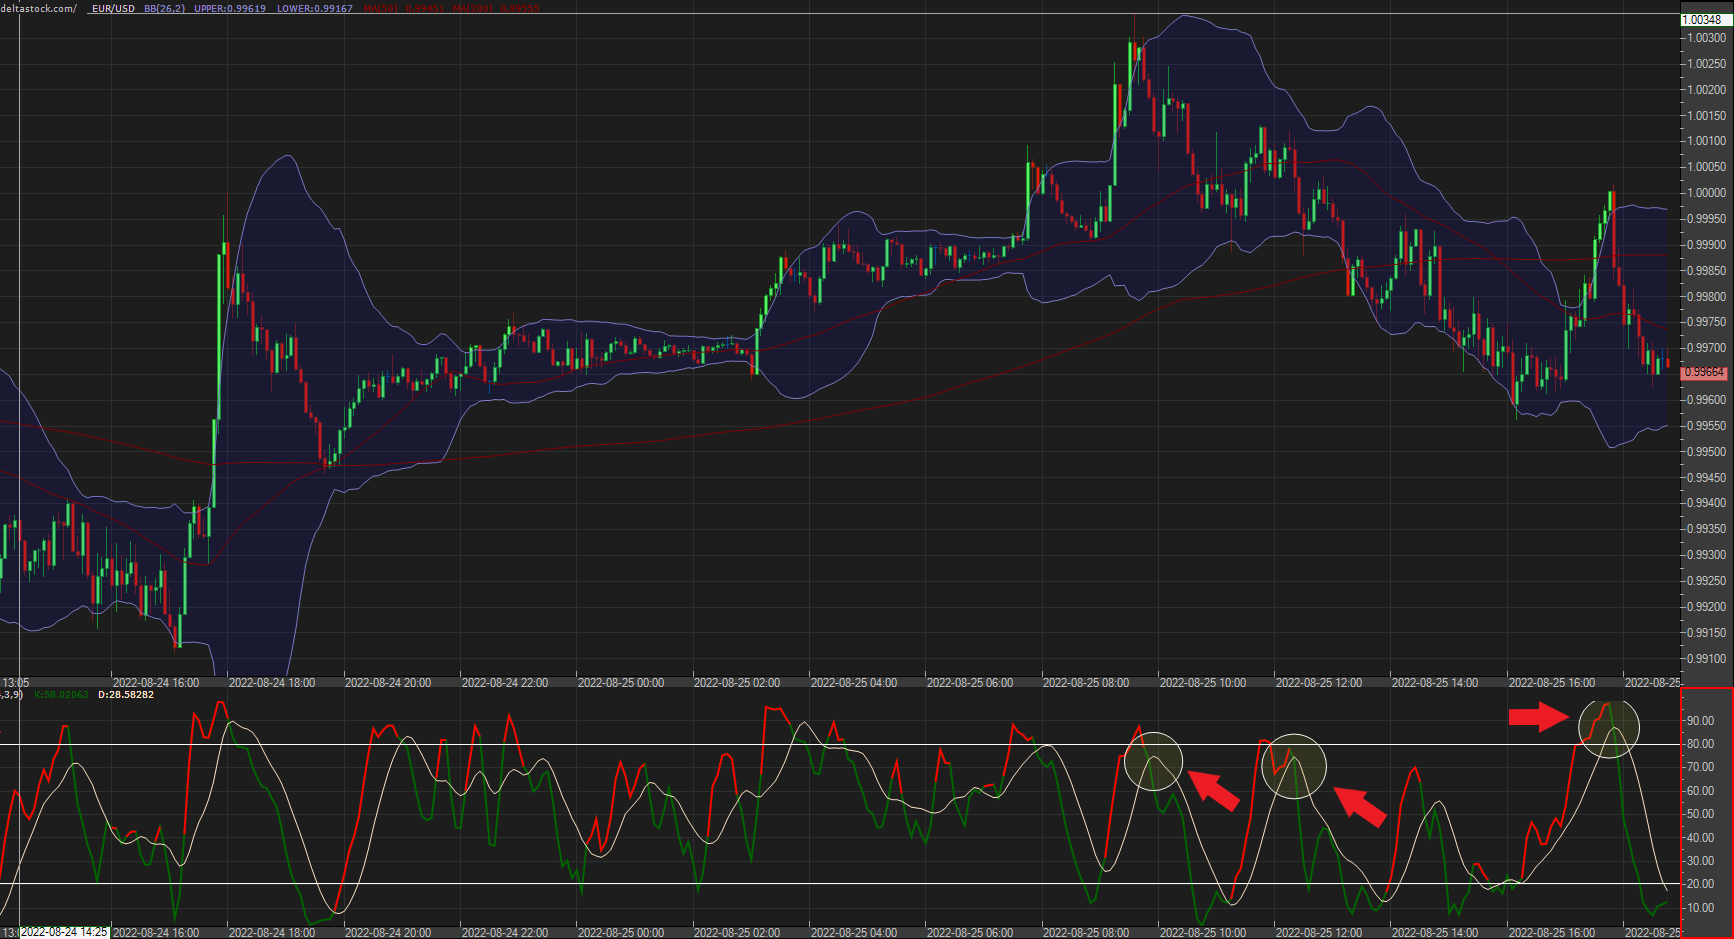
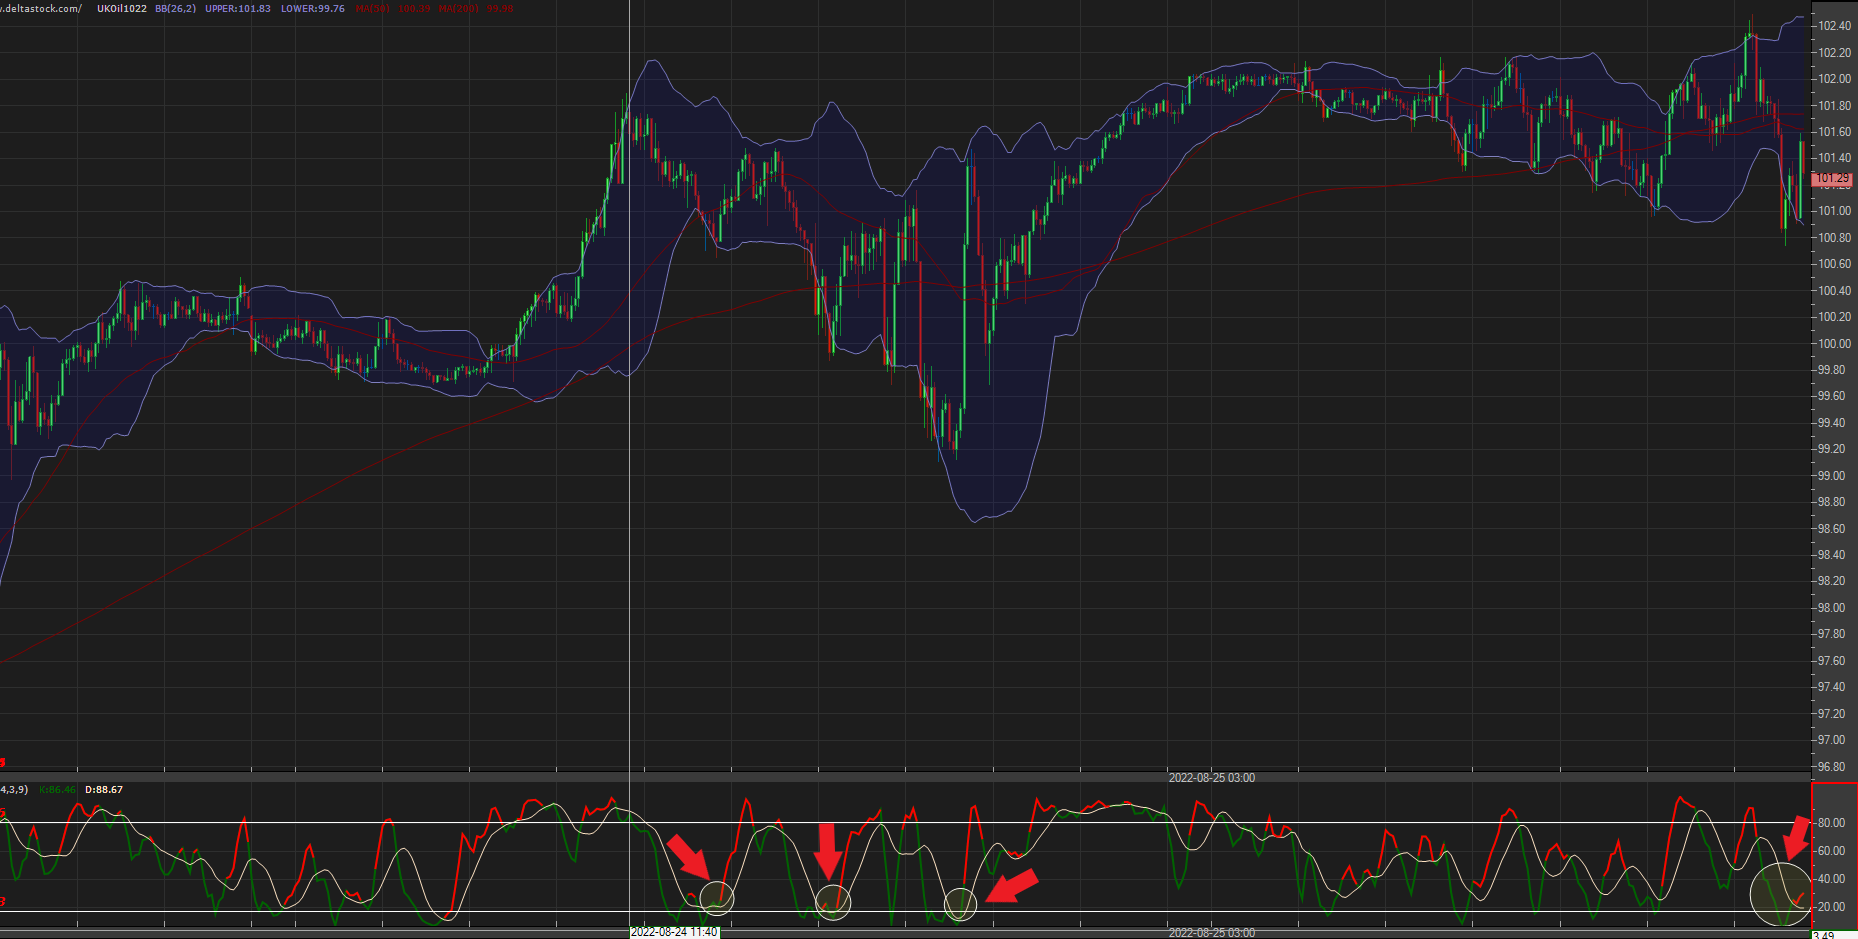
Source: Delta Trading
Above, we see the indicator represented by two coloured lines – one is yellow and one is green. Whenever these lines cross, this could indicate that a change in the market’s trend is just around the corner. Essentially, if the green line dips below the yellow line, as is the case above, swing traders could consider placing short positions at these crossing points, unless the price drop has crossed the lower border of the stochastic oscillator (20 and below).
Source: Delta Trading
On the second chart, we see the inverse example – each time the green line rises above the yellow one, swing traders may consider opening a long position. However, the line should not pass the higher border of the indicator (80 and above).
Conclusion
Swing trading is a hybrid style that can be incorporated into a wide variety of short-term and longer-term strategies, provided that the trader doesn’t outstay their welcome while riding a swing and knows their way around technical indicators. To summarise:
– Swing trading is all about riding just a small winning slice of a larger trend
– It is rooted in the firm belief that markets don’t go in a straight line, which means that there are profits to be made from all the daily minor oscillations within an asset’s price
– Pinpointing the exact “swing lows” or “swing highs” isn’t the point of this style, but rather making the most of any predicted swing in the safest manner possible
– Swing traders are known to hold positions for mere minutes up for several days at a time – the exact period will vary according to the type of market and the trader’s risk appetite
– Two of the most popular swing trading strategies are called range trading and breakout trading, both of which revolve around capitalising on short-term movements
– Swing trading requires proficiency with many different technical indicators, the most popular of which include moving averages, the RSI, and the stochastic oscillator
***
Looking to practice swing trading on your own terms? Open a free demo account with virtual €10,000 and access over 1000 markets in a real market environment, without risking real funds.
OR
Disclaimer: This article is for information purposes only. The information herein provided does not constitute a buy or sell recommendation for any of the financial instruments herein analysed.
Deltastock AD assumes no responsibility for errors, inaccuracies or omissions in this article, nor shall it be liable for damages arising out of any person’s reliance upon the information on this page. Deltastock AD shall not be liable for any special, indirect, incidental, or consequential damages, including without limitation, losses or unrealised gains that may result.