
Source: Dreamstime
We consider our customers as part of our team. Therefore, we will provide you with various methods and approaches that are used by professional traders. Our aspiration is to equip you with various tools and information and to create a traders’ ecosystem that would be useful and help you navigate the markets.
In addition to the daily analyses of Deltastock, we are starting a regular analysis of some of the most traded instruments by our clients. We will start with the German index EUGERMANY40.
Also, you can read our expectations for the major currencies for the first half of 2023.
Indices are indicative for the overall mood of the markets. They have the necessary volatility, which makes them suitable for trading with any time horizon.
First, let’s provide some context and then we’ll demonstrate two methods of analysis with objective criteria.
From a statistical perspective, we will first identify the months and days of the week in which the index has performed best historically.
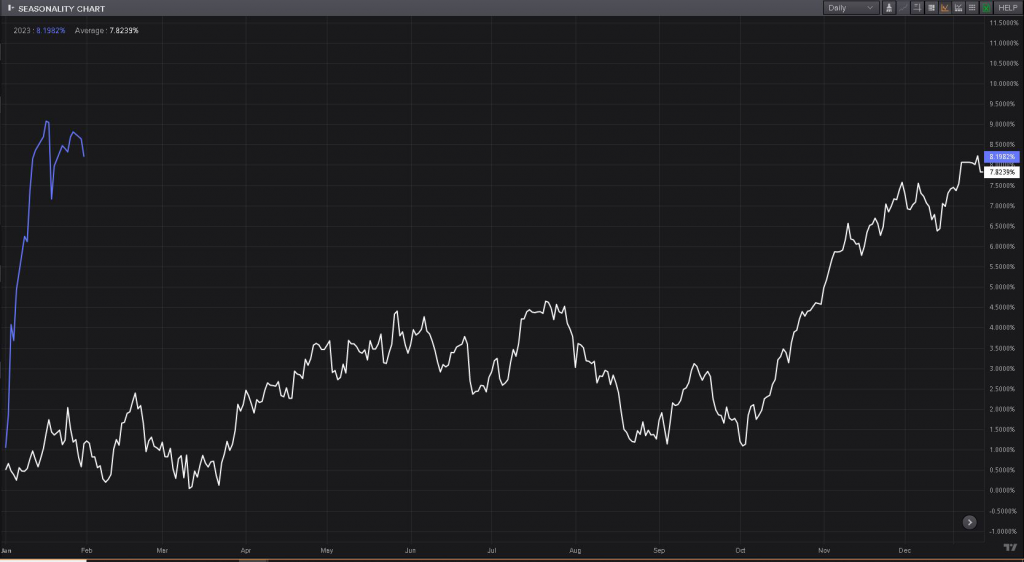
The below chart shows that February is one of the weakest for the index based on its historical performance over the last 20 years (white curve).
The purple curve represents the current percent change of German index EUGERMANY40 from the beginning of 2023.
Source: Reuters Eikon
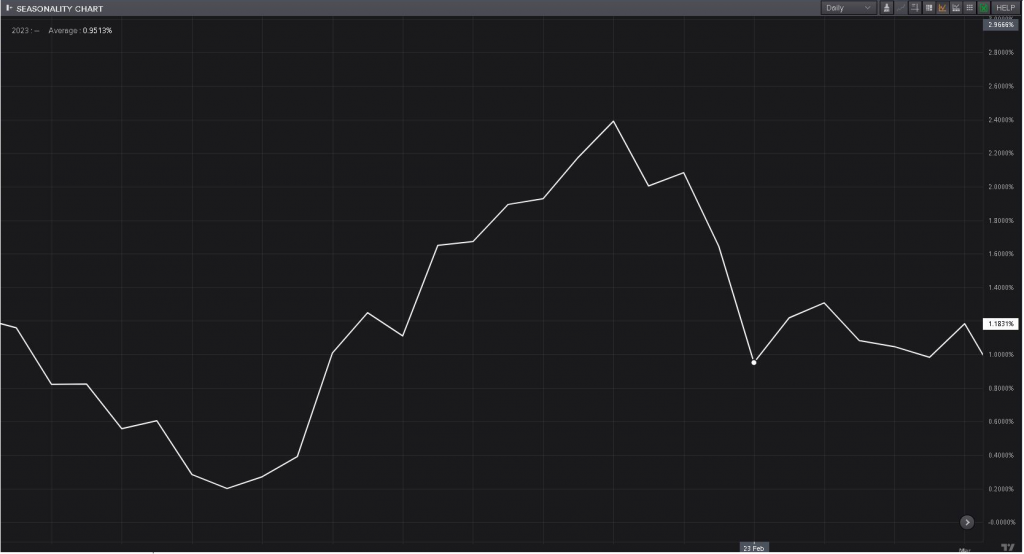
Due to the above historical data, we would like to know in which trading days of the week the German index tends to underperform. The chart below, based on broader historical periods, helps us with this.
Source: Reuters Eikon
Based on the above information, we see that the German index has a tendency to be negative in February, and this is especially pronounced on the first and fourth trading days of the week during February.
Be advised that the above information IS NOT a timing tool, but rather a preliminary map that shows us the statistical advantage rendered from historical trends.
Finally, we refine our analysis through the system below, which is based on monetary conditions and central bank policy. Here we mean that at a steeper yield curve (also known as interest rates term structure), markets tend to perform better. The yield curve is related to the tendency of banks to give loans, as well as of the companies to seek financing by directly issuing bonds to the market. As a general rule, when the yield profitability is steep, this shows that we have favourable conditions for credits and when the curve is inverted, this shows that the short-term bonds have a relatively high interest rate, which does not stimulate the banks to credit the business and the companies to borrow money.
The curve of profitability directly affects the discount factor of the companies’ projects and the interest differential (the difference between deposits and credits) of the banks.
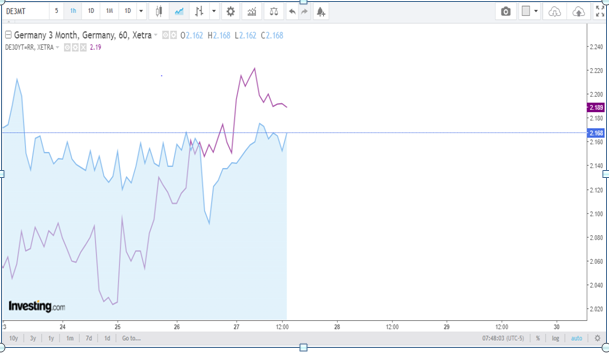
If the ratio of the 30-year German government bond yield to the 3-month German government bond yield is greater than 1.15, this would favour long positions. If the ratio is below 1.15 this would favour shorts. The idea behind this is that with a steeper yield curve, markets tend to perform better, because of the term structure of interest rates.
The below chart shows the 30-year yield (purple curve) and the 3-month yield (solid curve) for the past week.
Source: www.investing.com
In this case, the ratio is 1.009, which shows us that the German index could underperform and short positions are favoured according to this analysis.
The above system is for analytical purposes only and it is NEITHER A TIMING TOOL, NOR A TRADING RECOMMENDATION.
In the near future, we plan to offer you more interesting features and we strongly encourage you to follow our site and blog for more exciting initiatives and, above all, to provide us with feedback on our publications and matters related to international financial markets that interest you.
Risk warning:
This article is for information purposes only. It does not post a buy or sell recommendation for any of the financial instruments herein analysed.
Deltastock AD assumes no responsibility for errors, inaccuracies or omissions in these materials, nor shall it be liable for damages arising out of any person’s reliance upon the information on this page.
76% of retail investor accounts lose money when trading CFDs with this provider.