
Welcome to this week’s publication where we’ll be analysing the USTECH100 index. Last week was particularly volatile for the stock market, with the index dropping more than 700 points since the start of the month on fears that the Federal Reserve would be more aggressive in its tightening of monetary policy. These fears were prompted by the release of the minutes from the Fed’s January meeting, which revealed that some policymakers were considering raising interest rates by 50 bps due to concerns about rising inflation. As a result, investors are now closely watching the Fed’s next moves and any indications of when and how it might adjust its policies.
Unfortunately, the fears of inflation that have been worrying investors were not assuaged by last Friday’s economic data. The Federal Reserve’s preferred inflation gauge, the Personal Consumption Expenditures (PCE) price index, showed a substantial increase of 4.7% year-over-year in January, significantly higher than the estimated 4.3% and the previous month’s reading of 4.6%. This news has further scared equity markets, leading to a continued sell-off in U.S. equities. Bond yields have also been rallying in response to the inflation data, with the yield on the 2-year Treasury note reaching levels above 4.7%, which have not been seen since 2008. This suggests that investors are increasingly worried about inflationary pressures and the potential for the Fed to keep interest rates higher for longer.

Source: CNBC
As of the time of writing, the sentiment among investors is likely to remain negative in the near term. This is particularly true in light of the recent pricing of Fed funds futures, which have fully priced in rate increases in March, May, and June of this year. This suggests that investors are preparing for a more aggressive response from the Fed to combat inflation, which could further dampen market sentiment.
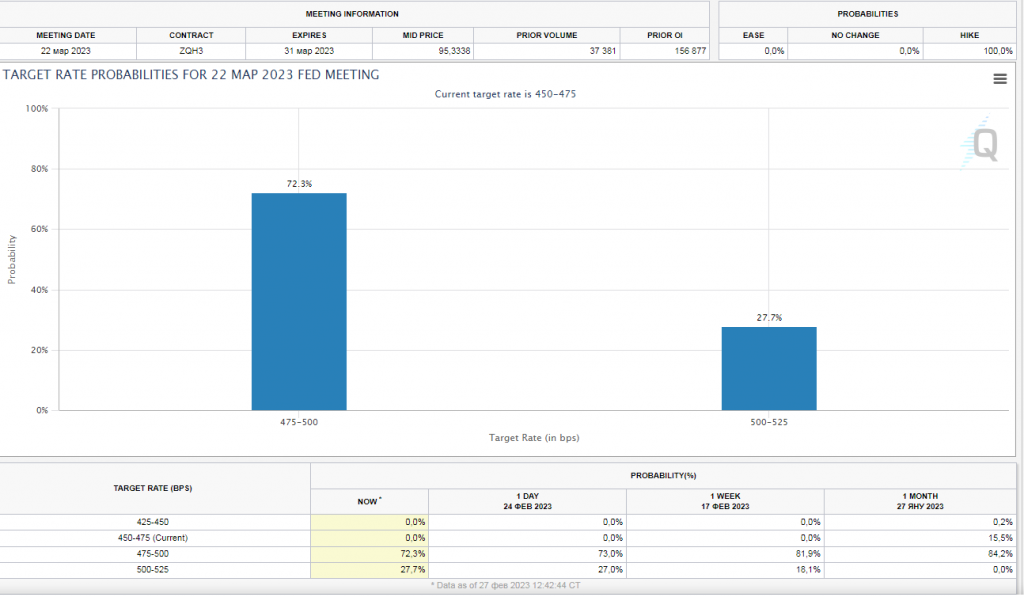
Source: CME
Friday’s close below the 12000 level for the USTECH100 index is a concerning development, however it is still not trading below the 200 SMA, which is providing support at 11900. The 200-day SMA is a widely used technical indicator that many traders and investors use to assess the long-term trend of a stock or index. If the index falls below this level, it may be facing significant selling pressure and more pain may be on the horizon. This is particularly true, given the recent increase in inflation data and the expectation of rising interest rates, which could further dampen investor sentiment.
Last week was not all bad for one stock that had particularly impressive performance was NVIDIA Corporation (NVDA). The chipmaker saw a remarkable rally of more than 25%, making it the top performer in the USTECH100. The stock’s strong performance was largely driven by the company’s earnings report, which showed strong focus on artificial intelligence, mentioning “AI” 91 times. Additionally, NVIDIA’s positive guidance for the upcoming quarter and fiscal year also contributed to the rally. Given the current market sentiment, however, these gains might not last.
A boost to the index can be provided by better than expected earnings for ZOOM with the consensus EPS being ($0.04), expected to be published today.
This week, all eyes will be on two critical economic indicators that are set to be released – Thursday’s initial jobless claims report and Friday’s ISM services data. The former will provide us with an idea of the number of individuals who have filed for unemployment benefits for the first time in the past week, which is a key indicator of the health of the job market. The latter will give us insights into the state of the services sector, which is a significant contributor to the overall U.S. economy. Together, these reports will help us understand how the economy is performing.
In addition to this, the FOMC members which will be speaking this week are:
- JEFFERSON (MON. 10:30AM GMT)
- GOOLSBEE (TUES. 2:30PM GMT)
- WALLER (THURS. 4:00PM GMT)
- LOGAN (FRI. 11:00AM GMT)
Risk warning:
This article is for information purposes only. It does not post a buy or sell recommendation for any of the financial instruments herein analysed.
Deltastock AD assumes no responsibility for errors, inaccuracies or omissions in these materials, nor shall it be liable for damages arising out of any person’s reliance upon the information on this page.
76% of retail investor accounts lose money when trading CFDs with this provider.